DATA DOES NOT HAVE TO BE DULL!
I thought it might be interesting to show some specific examples of how I turn what appears to be the dullest of data into something compelling visually.
These are some infographics I created for the fine folks at Linden Publishing for an upcoming book on Content Marketing. I’ll show you the data in the original form it was given to me (in blue) followed by the infographic I created below it. Many times I’ll look at the information in a different way and even flip it on it’s head to make something clearer and more interesting.

B2B Infographic - Linden Publishing (Marketing Director: Jaguar Bennett)

Buyer’s Journey Infographic - Linden Publishing (Marketing Director: Jaguar Bennett)

Lead To Sale Infographic - Linden Publishing (Marketing Director: Jaguar Bennett)

Problem To Solution Infographic - Linden Publishing (Marketing Director: Jaguar Bennett)
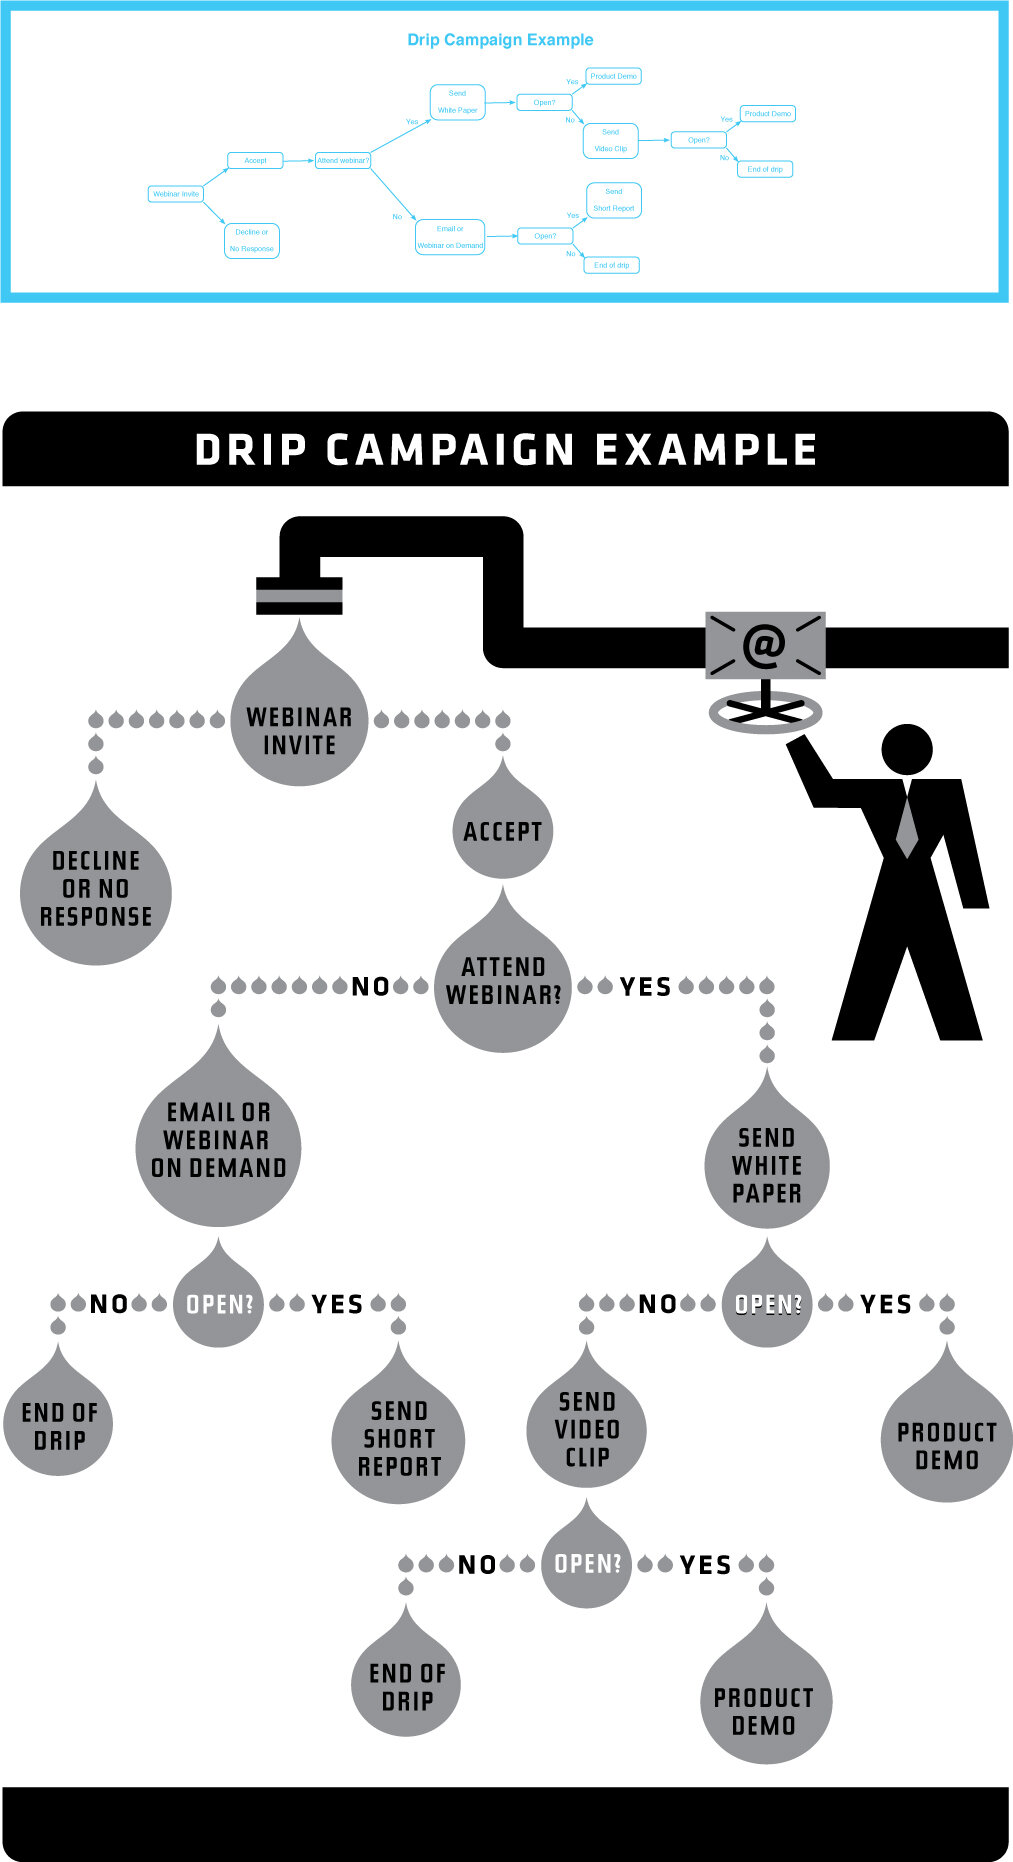
Drip Campaign - Linden Publishing (Marketing Director: Jaguar Bennett)
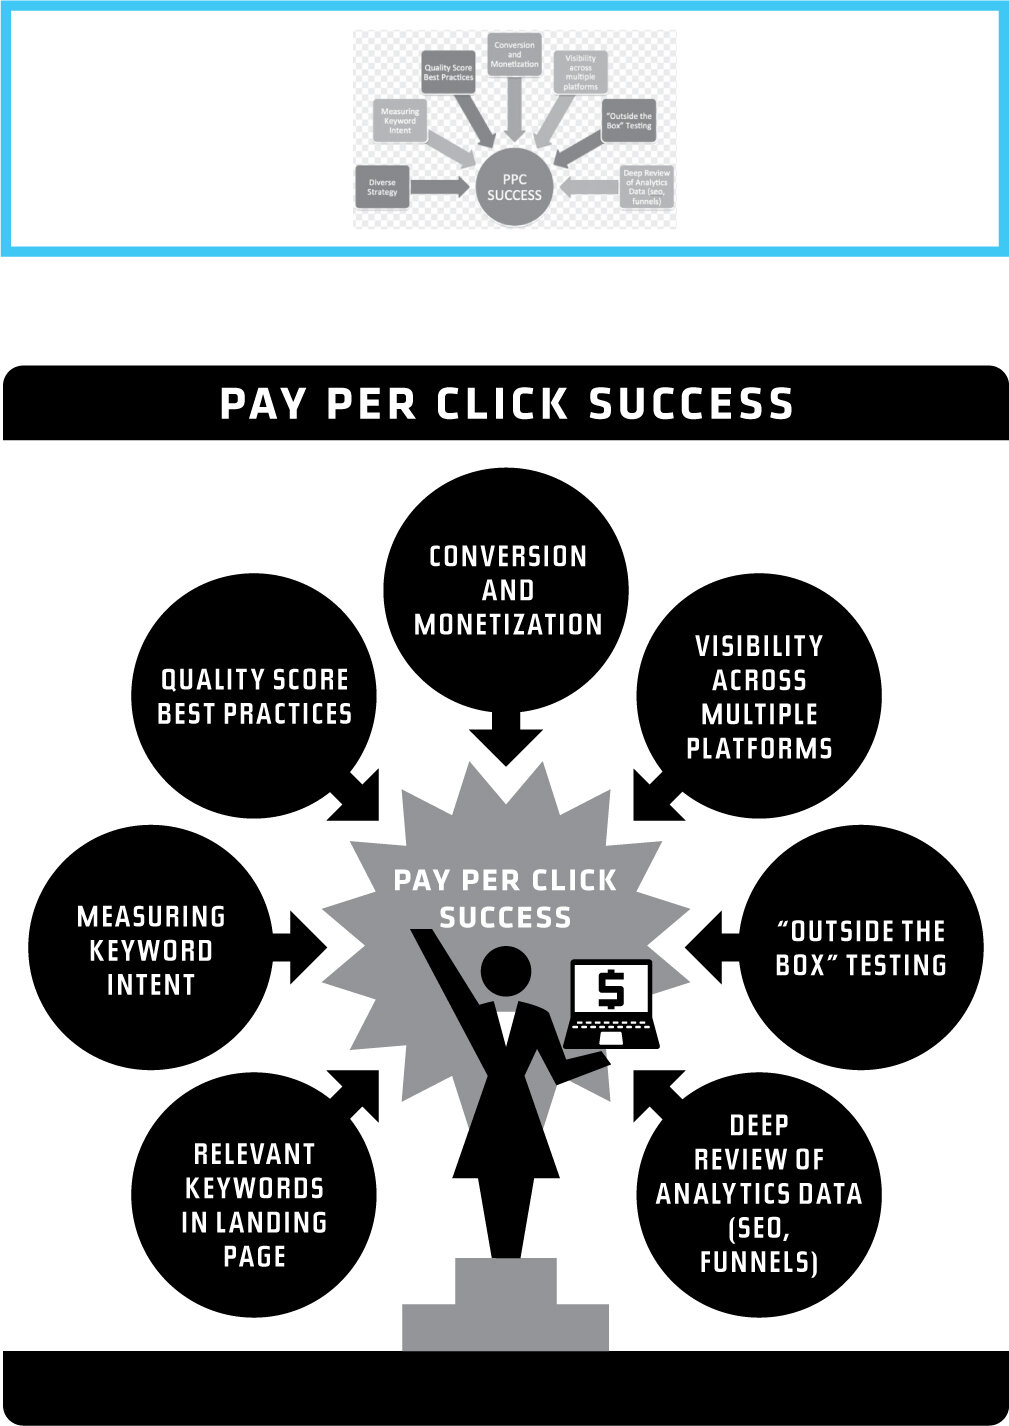
Pay Per Click - Linden Publishing (Marketing Director: Jaguar Bennett)